Simple, Refined and Complex Sugars / Glycemic Index, Load, Satiety and Health Effects
| Diets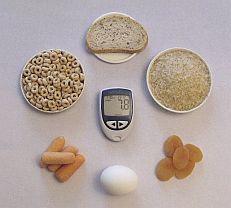
The Glycemic Index (GI) has over the years become the focus of heated debates among various health advocates, particularly in regard to weight and blood sugar management. Proponents for the utilization of the glycemic index argue that the consumption of low GI meals (lower than 55 on a scale from 0 - 100) results in greater weight loss [1] and satiety compared to the consumption of high (greater than 70) GI meals, while opponents of the glycemic index question these findings and argue against high-glycemic index foods promoting obesity.
Based on how fast a particular food raises blood sugar over a 2 - 3 hour period, the glycemic index uses a numbering index, whereby glucose is the reference point of 100 (some sources put glucose at 140 and use white bread as a reference of 100). A baked potato for instance ranks 85 on that scale, brown rice 59, white bread 72, table sugar 65, bananas 51, milk 30, grapefruit 25, and broccoli 6. However, when comparing the databases of different researchers, one can find fast discrepancies with their rankings of certain foods, which doesn't help to support the validity of that system.
Defendants of the glycemic index explain that one reason for these inconsistencies is the fact that within the same food group there can be a tremendous variation in the GI.
Rice for instance ranges from 38 - 94 (!) on the glycemic index scale as a result of rice being available as white and brown rice, and there is short-grain, medium-grain, and long-grain rice, as well as those types of rice that either do, or do not contain amylose - all having varying effects on the glycemic index.
It is interesting to note the calcium / magnesium ratio for instance also varies tremendously between white, brown, and between short, medium, and long-grain rice.
Hemoglobin A1c (HbA1c) measurements appear to support the notion that low-glycemic index foods are particularly advantageous for diabetics by reducing measurements by almost ½ of a percentage point, and thus lessening the risk of developing renal and vascular complications.
However, there are known inconsistencies with the lab tests and their interpretation, and levels can vary up to 1% among individuals regardless of the glycemic index of the foods consumed. HbA1c is a lab test that measures the number of glucose molecules attached to hemoglobin over a period of 90 - 120 days, which is expressed as a percentage, with 3 to 6% considered to be normal, and lower being better. This gives a better average of blood sugar management with diabetics since it is averaged over 2 - 3 months, in contrast to the daily high / low glucose fluctuations when measuring blood sugar.
One of the biggest predicaments surrounding the glycemic index are the inconsistencies with specific foods - where the preparation of a particular food, or the ripening process can change the GI as much as 30%. There is also the total rise versus acceleration in blood glucose and a lack of actual units or measurements per food item, and the question remains why some people are affected by the glycemic index, and why others show little or no response at all. It is also hard to convince anyone that according to the glycemic index, white table sugar rates as healthy, or "healthier" than a slice of watermelon, a baked potato, or a bowl of rice!
| Food Glycemic | Index | Load |
|---|---|---|
| White wheat flour bread | 70 | 10 |
| Whole wheat flour bread | 69-73 | 9 |
| Gluten-free multigrain bread | 66-92 | 10 |
| Whole-meal rye bread | 52-64 | 8 |
| Kaiser roll | 73 | 12 |
| Spaghetti, 5 min | 35-41 | 18 |
| Spaghetti, 20 min | 58-64 | 27 |
| Spaghetti, wholemeal | 32-42 | 16 |
| Milk, whole | 23-31 | 3 |
| Milk, skim | 27-37 | 4 |
| Ice cream | 54-68 | 8 |
| Yogurt, low-fat | 26-28 | 7 |
| Sweet corn on the cob | 49-57 | 17 |
| White rice | 57-71 | 23 |
| Brown rice | 50-60 | 18 |
| Parboiled rice | 48-72 | 24 |
| Apple | 36-40 | 6 |
| Banana, ripe | 51 | 13 |
| Dates, dried | 82-124 | 44 |
| Grapefruit | 25 | 3 |
| Grapes | 43-49 | 8 |
| Orange | 39-45 | 5 |
| Peach | 28-56 | 5 |
| Pear | 36-40 | 4 |
| Prunes, pitted | 25-33 | 10 |
| Watermelon | 59-85 | 4 |
| Raisins | 53-75 | 28 |
| Baked beans | 40-56 | 7 |
| Navy beans | 32-44 | 12 |
| Food Glycemic | Index | Load |
|---|---|---|
| All-Bran | 37-47 | 4 |
| Cheerios | 74 | 15 |
| Soda crackers | 74 | 12 |
| Cornflakes | 78-84 | 21 |
| Oatmeal | 54-62 | 13 |
| Instant oatmeal | 65-67 | 17 |
| Potato chips | 51-57 | 11 |
| Pretzels | 74-92 | 16 |
| Honey | 50-60 | 10 |
| Sucrose | 63-73 | 7 |
| Fructose | 17-21 | 2 |
| Xylitol | 7-13 | 9 |
| Apple juice | 39-41 | 12 |
| Grapefruit juice | 48 | 11 |
| Orange juice | 46-54 | 13 |
| Tomato juice | 34-42 | 4 |
| Green peas | 43-53 | 3 |
| Carrots | 31-63 | 3 |
| Parsnips | 81-116 | 12 |
| Baked russet potato | 73-97 | 26 |
| Boiled white potato | 41-59 | 14 |
| Baked white potato | 60 | 18 |
| Sweet potato | 54-68 | 17 |
| Yam | 29-45 | 13 |
| Lentils | 28-30 | 5 |
| Chickpeas | 22-34 | 8 |
| Peanuts | 6-22 | 1 |
| Soybeans | 15-21 | 1 |
| Kidney beans | 24-32 | 7 |
The Glycemic Load (GL) was developed trying to improve on some of the concerns raised regarding the glycemic index by calculating the glycemic index of a food item times its carbohydrate content in grams. It uses a scale similar to the glycemic index where for instance 10 or less is low (good), versus 20 or higher being high (to be avoided). On the glycemic load index, one baked potato ranks 26, one banana ranks 13, one cup of 2% milk ranks 4, and ½ cup of steamed broccoli ranks 1.
According to glycemic load proponents, the long-term consumption of a diet with a high glycemic load increases the risk of developing Type II diabetes and elevated levels of C-Reactive Protein (CRP), both of which increase the risk of developing cardiovascular disease.
By applying the principles of the glycemic load, the Nurses' Health Study concluded that "A diet high in glycemic load may increase the risk of pancreatic cancer in women who already have an underlying degree of insulin resistance."
An Italian study concluded that "This study supports the hypothesis of a direct association between glycemic index & glycemic load, and ovarian cancer risk and, consequently, of a possible role of hyperinsulinemia / insulin resistance in ovarian cancer development." Of course it is one thing to propose a hypothesis, and it is another thing to actually present concrete evidence that consuming baked potatoes creates a greater risk in developing these conditions than consuming plain table sugar.
From a clinical perspective, many individuals clearly have an abnormal response to what is considered to be high glycemic food sources, and for them, the glycemic index / glycemic load can be somewhat of a guide and quite helpful. The question remains --- is it really high glycemic foods, or is it the simple sugar content of these foods? When one analyzes the chemistry of these people, it becomes apparent that their bodies are simply unable to compensate because of chemical or nutritional shortcomings.
The list of players affecting insulin / glucose metabolism is quite lengthy, and includes manganese, sodium, chromium, vanadium, biotin, potassium, Vitamin C, Vitamin B6, niacin / niacinamide, various hormonal interactions, and an individual's weight and physical activity. Other nutrients involved include magnesium, calcium, germanium, zinc, Vitamin E, folate, PABA, and essential fatty acids (EFAs).
Sodium reduces insulin response, and it is along with biotin an important factor to prevent or reduce erratic glucose level changes, including on an in-between meal basis. Manganese, and to some extent chromium, niacin and niacinamide control glucose response and liver glycogen storage (Mn), while potassium, Vit B6 and Vitamin C either help stabilize, or interfere with that process, depending on a patient's hypoglycemic or hyperglycemic disposition. (see also Acu-Cell "Hypoglycemia").
If one is able to correct and balance these factors, the Glycemic Index becomes meaningless and can be ignored. To a lesser degree, the same applies to the Glycemic Load, although its greater emphasis on the carbohydrate content of specific foods makes it somewhat more valuable for anyone suffering from any sugar metabolism-related problems, particularly diabetes. However -- as much as they have become a dinosaur in the eyes of some proponents of low-carb dieting - discriminating between Simple, Refined, and Complex Carbohydrates is still as important and relevant as ever, particularly as far as long-term health effects on the entire body are concerned!
Simple, Refined, and Complex Sugars / Carbohydrates:
Simple Carbs: White sugar, brown sugar, honey, agave nectar, corn syrup, maple syrup, sorghum syrup, molasses. Sweet / ripe fruit (bananas, pears, figs, dates, raisins, sweet melons...), dried fruit, fruit juices (apple juice), canned fruit (peaches, mixed fruit). maltodextrin, stevia, anise, licorice. Sucrose, glucose, fructose, maltose, dextrose, galactose, trehalose, D-ribose, and other "...ose" variations. Candy, ice cream, chocolate, pop, donuts, cakes, cookies, sweetened cereal & granola, jam, marmalade.
Alcohol, in contrast to other simple carbohydrates, does not have atherogenic (artery-clogging) properties.
Sugar Alcohols / Polyols:
Glycol (2), glycerol (3), erythritol (4), threitol (4), arabitol (5), xylitol (5), ribitol (5), mannitol (6), sorbitol (6), dulcitol (6), iditol (6), isomalt (12), maltitol (12), lactitol (12),
Xylitol (a 5-carbon sugar alcohol) and some other polyols listed above, do not share the typical "unhealthy" attributes of Simple Sugars / Carbohydrates. Click here for positive / negative health effects of Xylitol.
Refined Carbs: Most refined and processed, but unsweetened grain products, cereal, bread, pizza crust, buns, pasta, general baked goods, bagels and granola without added sugars, polished rice.
Complex Carbs: Legumes, such as lentils, peas and beans. Vegetables, such as beets, broccoli, cabbage, carrots, cauliflower, corn, lettuce, peppers, potatoes. Nuts and seeds, unpolished, parboiled, or brown rice, whole grains, whole-grain flour, bread, pasta, & cereal.
What are the Health Effects of Simple, Refined & Complex Sugar / Carbs?
Medical problems developing as a result of consuming refined or complex carbohydrates are generally of a digestive nature, such as longer transit time (refined carbs), or abdominal bloating (complex carbs), or they adversely affect mineral uptake and balance (iron, calcium, zinc...). With the exception of tooth decay, which can be linked to the consumption of various types of carbs, medical problems resulting from ingesting simple carbs (sugar, honey, molasses, syrup, candy, pop, cakes, sweet / overripe fruit...) are much more significant:
- In contrast to complex carbs, simple carbs require more resources of specific nutrients such as biotin, Vitamin C, manganese and chromium.
- Manganese is unaffected by complex carb intake, but simple carbs lower manganese levels in those with hypoglycemic (low blood sugar) tendencies, and they raise manganese levels in individuals with an inclination for hyperglycemia (high blood sugar).
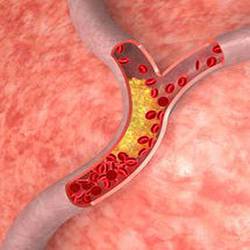
- Simple carbs (including fructose from fruit) promote the formation of VLDL triglycerides, while refined or complex carbs don't, so in contrast to complex carbs, simple carbs raise the risk for cardiovascular disease. Sweetened beverages also cause more heart failure in men.[2]
- Simple carbs decrease omega 3 Essential Fatty Acids (EFAs) and germanium levels (which have blood thinning properties), and complex carbs support or enhance both.
-
Unlike simple carbs, complex carbs are fiber-rich, which:
- improves digestive health and transit time,
- may result in lower absorption / bioavailability of specific minerals, particularly calcium, iron, and zinc.
- slows glycogen conversion, which better stabilizes blood sugar. - Unlike complex carbs, simple carbs (sweets) can cause pain when in contact with exposed dental roots.
- Simple carbs can promote osteoporosis in trabecular bone through the chromium / parathyroid mechanism, while complex carbs can promote osteoporosis in cortical bone through a calcium lowering effect, which they have in common with high protein / phosphate sources.
- Simple carbs - unlike complex carbs - trigger more medical symptoms such as headaches, fatigue, depression, drowsiness, skin eruptions, mucus / throat discomfort, or sugar withdrawal symptoms.
- Simple carbs - unlike complex carbs - can be a causative, or contributing factor with mood disorders, and - particularly with children - behavioral problems. (see Acu-Cell "ADD / ADHD" and "Chocolate").
- According to some research, simple carbs - unlike complex carbs - promote free radicals.
- In contrast to complex carbs, simple sugar increases the risk of developing pancreatic cancer by between 50 - 90% according to Swedish research (AJCN 2006).[3]
- Simple carbs - unlike complex carbs - effect an opposing change in hyper / hypoglycemics, resulting in a higher sodium / potassium ratio with hyperglycemics, and a higher potassium / sodium ratio with hypoglycemics, which can subsequently lead to an increase in blood pressure with the former, and a decrease in blood pressure with the latter.
- In contrast to complex carbs, ingesting simple carbs reduces the WBC's ability to destroy bacteria (phagocytosis). In sugar-intolerant types, this can lead to increased pus formation, and in patients with leukemia to an increased WBC count. There is also an inhibiting effect on the immune system by the formation of AGE's (advanced glycosylation end product).
In a comparison Dr. Ronald Roth did some years ago of patients who had actual episodes of ischemic heart disease and strokes, the incidence of elevated VLDL triglycerides versus elevated LDL cholesterol was 2.2 : 1. Reports by other researchers ranged from 2 : 1 to as high as 4 : 1 according to their observations, so simple sugar can be considered to be a much bigger culprit with cardiovascular disease or ischemic stroke than fats.
On the other hand, sodium counteracts the effects of saturated fats and/or transfatty acids, so people who retain a lot of sodium enjoy a moderate amount of protection from ischemic heart disease or stroke, but suffer from a greater risk of hemorrhaging stroke or (congestive) heart failure. In contrast, low aldosterone (low sodium) types are at a much higher risk from the effects of LDL cholesterol and related problems, but are less prone for high blood pressure-related strokes.
The Satiety Index (SI) is one of the most interesting concepts created by rating foods by their ability to be more or less satisfying than white bread, which is used as a reference index of 100. Food items rated less satisfying and filling over a two-hour period following their consumption were given a score below 100, while food items that were rated more satisfying and filling compared to white bread were given a score above 100. Susanna Holt, Ph.D, who developed the satiety index, found that:
- Cakes, donuts and candy bars were among the least filling, averaging about 65 to 70%.
- French fries, breakfast cereals, white pasta, rice, and bananas ranked from about 100 to 150%.
- Cheese at 146% was about 3x more filling than croissants, which were rated at only 47%.
- Eggs, beef, apples, oranges, grapes, brown pasta, whole grain bread and popcorn averaged from about 150 to 200%.
- Oatmeal and fish ranked 209% and 225% respectively.
- Potatoes were the clear winner with 323% as the most satisfying food.
According to this satiety index, several interesting - and somewhat unexpected discoveries emerged:
- Fat is by far not as satisfying as thought.
- Protein made it into a higher, but not as high as expected category.
- Pastries and most sweets were the least satisfying, which was expected.
- Potatoes (unlike French fries with the fat) were by far the most satisfying foods, which took everyone by surprise since they rank rather poorly according to the glycemic index and the glycemic load.
Variations of these scores for individuals with different biochemical backgrounds can be expected, since eating fruit makes some people hungry very quickly, while in contrast to the findings in the study above, fatty foods do provide longer-lasting satiety for them, however the poorer scores given to donuts and candy bars certainly supports their reputation of not only being addictive, but the least filling and satisfying.
It is unfortunate that the satiety of these foods was studied for 2 hours only instead of extending the trial period to perhaps 4 - 5 hours. This would have more realistically reflected the time in-between meals for the average person, and so made it more practical to apply the satiety index on a day-to-day basis.
 Manganese may help with some symptoms of Parkinson's disease such as muscle rigidity and twitching...
 Research shows that phytosterols such as beta-sitosterol may help normalize the function of natural killer cells and T-helper lymphocytes...
 Iron deficiency may be suspect with some forms of ADHD. 84% of children with ADHD were found to have abnormally low levels of ferritin...
 A high intake of B Vitamins can trigger heart palpitations, HBP, major complications in patients with congestive heart disease...